The Number Your Build-versus-Buy Model Is Missing
Executive Summary
Every build-versus-buy model presented to an APAC fintech board compares the same two things: the fully-loaded cost of an employed engineer against the day rate of a rented one. Both numbers are usually correct. Together they answer the wrong question.
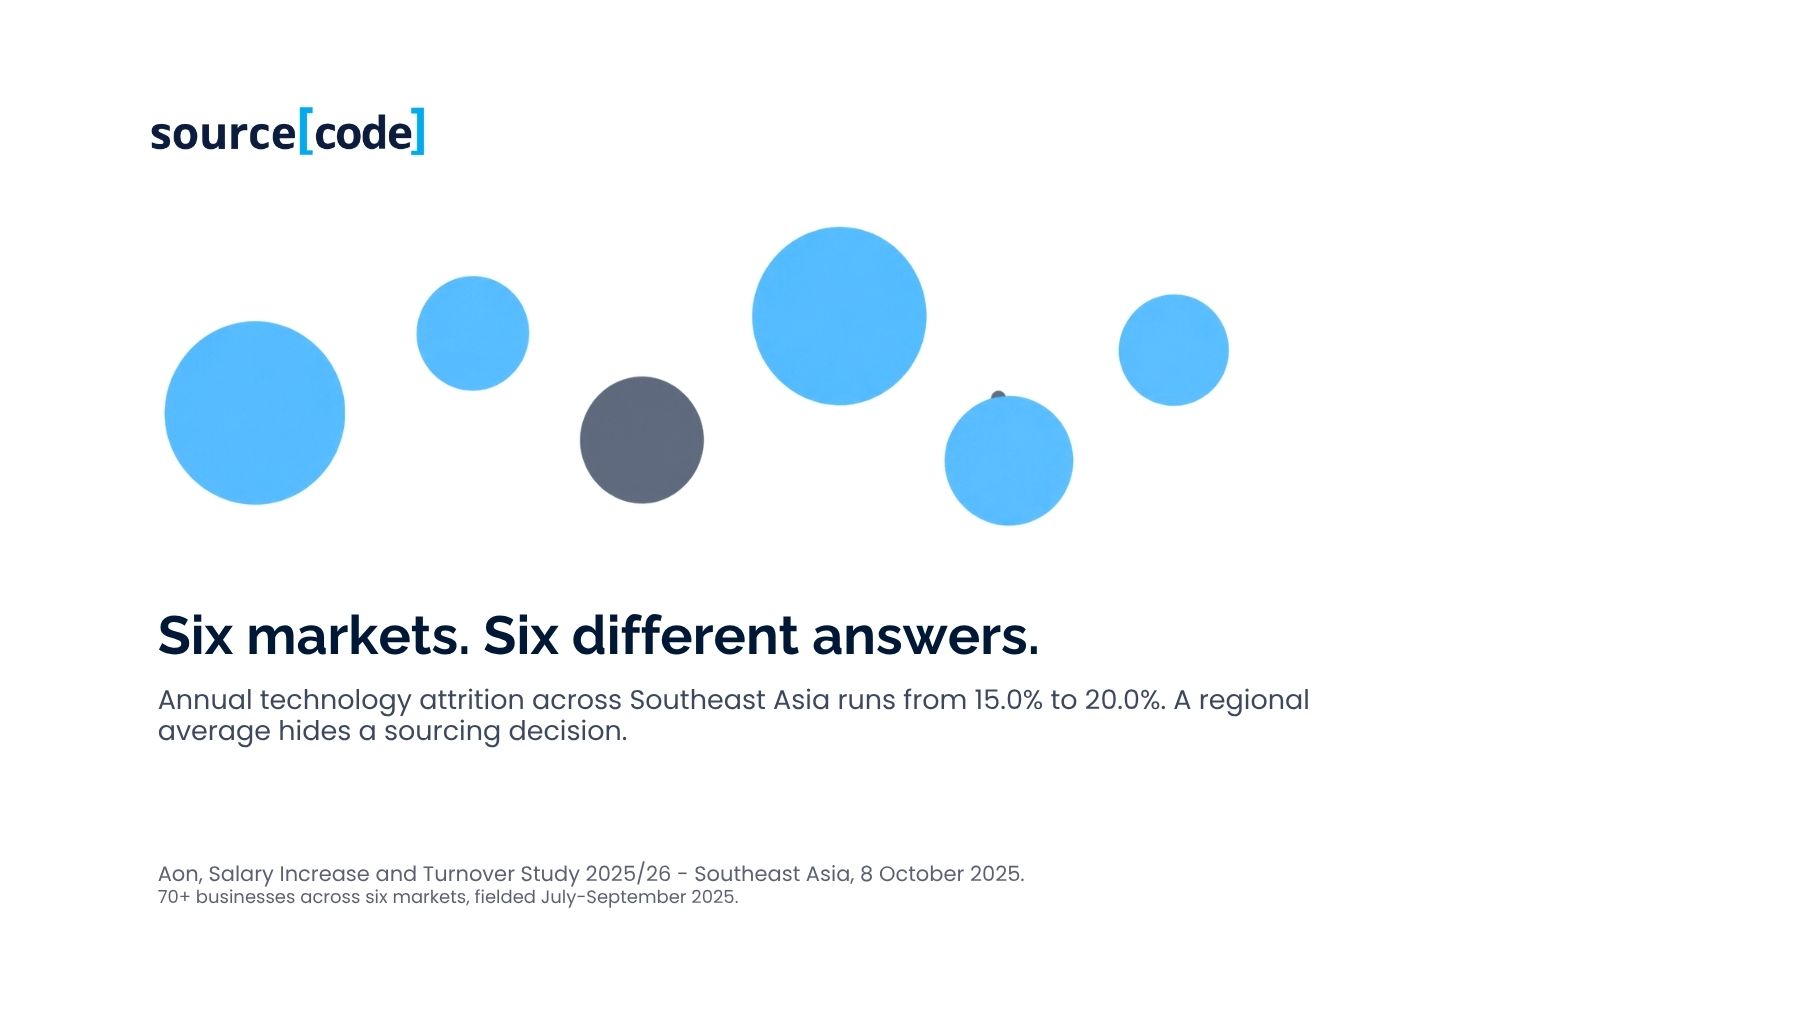
A rate card prices engineer-months. It does not price retained engineer-months - the ones still working on your systems two years from now, still holding the context, still able to answer a question without reading the code first. That distinction is not a rounding error in Southeast Asia. Aon's 2025 study of more than 700 businesses across six ASEAN markets put regional attrition at 17.5%, ranging from 15.0% in Vietnam and Indonesia to 20.0% in the Philippines (Aon, 2025). Compounded over twenty-four months, a team sitting on the regional average loses roughly one engineer in three. A team in Manila loses more than one in three.
That is not an argument against renting capability. It is an argument that both columns of the model are quoted in a unit nobody is actually buying.
The correction is arithmetic, not ideology. Divide the cost of an option by the fraction of its capacity you expect to still hold at the end of the horizon, and compare that. Two options priced identically per engineer-month can differ by twenty to thirty percent per retained engineer-month - and the gap is invisible in every spreadsheet that stops at the rate.
Bottom line for executives: you are not buying engineering hours. You are buying the subset of those hours that is still yours when the system they built needs changing. Price that unit, and the sourcing decision usually makes itself.
Introduction
This week's pieces have worked outward from a single theme: what an APAC fintech can actually promise. Monday argued that in embedded finance the margin now has a publication date. Tuesday argued that permission, not capital, is the scarcest input. Thursday's client spotlight showed a payments business that compressed the tail of its integration times and, in doing so, changed what its sales team was allowed to commit to.
Each of those rests on something unglamorous: whether the engineering organization behind them persists. Friday closes the week on that question, because it is the one most often decided on the worst available evidence - a rate comparison in a slide.
The timing is not incidental. On 28 July, Visa said it would cut roughly 2,600 roles, about 7% of its workforce and weighted toward technology and product, framing the reduction as an artificial-intelligence-driven efficiency programme (as reported by Fintech News Singapore and other trade press, 28-29 July 2026). Whatever one makes of the framing, the signal is legible to every fintech board in the region: the assumption that engineering capacity is a variable cost you can add and shed at will is being tested in public, at the largest payments network in the world.
Industry Context
Spending on financial-services technology in Asia-Pacific is not slowing. IDC put Asia-Pacific (excluding Japan and China) ICT spending at approximately US$647 billion in 2026, growing 5.4% year on year, with banking among the top three spending industries (IDC, 2026). The money is there. What is changing is what it buys.
Gartner's July 2026 forecast has worldwide IT services reaching US$1,570 billion in 2026, growing 5.3% - the slowest growth of any major segment - against software at 15.5% and data-centre systems at 62.5% (Gartner, 2026). Enterprises are shifting spend from bought effort toward owned capability. That is a global figure and should be read as such, but the direction is not in dispute.
The supply side is already adjusted. Nasscom's Strategic Review 2026 reports India's technology industry at roughly US$315 billion in revenue for FY26, growing 6.1%, on a workforce of about 5.95 million and net hiring of approximately 135,000 - around 2.3% headcount growth (Nasscom, 2026). Revenue growing at nearly three times the rate of headcount is the end of the linear staffing model at the region's largest supply base. Rate-card arbitrage is a depreciating asset, and the people selling it know it first.
Meanwhile the regulatory cost of renting capability is rising. The Monetary Authority of Singapore consulted between 6 March and 20 April 2026 on Guidelines on Third-Party Risk Management intended to supersede its outsourcing guidelines - and, critically, to widen scope from formal outsourcing arrangements to all reliance on third-party services, with registration obligations, a five-stage lifecycle and sub-contractor oversight, subject to a six-month transition on issuance (Monetary Authority of Singapore, 2026). A day rate has never included the cost of the governance now attaching to it.
Current Challenges
The labor market data explains why executives keep getting this wrong: hiring has become easier while keeping has not, and the two are routinely confused.
In Australia, Jobs and Skills Australia's Recruitment Experiences and Outlook Survey - around 800 employers surveyed each month - recorded a recruitment difficulty rate of 38% in November 2025, down twelve percentage points year on year (Jobs and Skills Australia, 2025). Easier hiring. In Singapore, the Ministry of Manpower counted 73,300 job vacancies in March 2026, with a vacancy-to-unemployed-person ratio of 1.46 (Ministry of Manpower, 2026a), and its Job Vacancies 2025 report records that while the overall share of vacancies unfilled for six months or more fell from 19.4% to 17.1%, the share for professional, managerial, executive and technical roles moved the other way - from 14.4% to 16.0% (Ministry of Manpower, 2026b). In a cooling market, the senior technical roles got harder to fill.
Cost is not moving in a single direction either. The Australian Bureau of Statistics' Employee Earnings and Hours survey for May 2025, released January 2026, puts the average ICT worker at A$2,577 per week - roughly A$134,000 annualized - while ICT managers averaged A$3,402 per week, down in nominal terms from A$3,584 in May 2023 (Australian Bureau of Statistics, 2026). Execution is holding its price; the coordination layer above it is repricing downward. Any model that treats the management overhead of a distributed vendor arrangement as free is assuming away the one line item the market is actively discounting.
And the replacement carries a premium. Aon found 42% of Southeast Asian businesses reporting hiring and retention difficulty and 63% facing current skills gaps, with new hires commanding salary premiums of 1.3% to 8.2% over incumbents (Aon, 2025). The engineer you replace costs more than the engineer you lost - before anyone has written a line of code.
Key Trends
Three movements are worth separating from the noise, because they point the same way.
Vendor churn is now disclosed, and it is not zero. Tata Consultancy Services reported last-twelve-months voluntary attrition of 13.6% in IT services against a closing headcount of 593,798 in its Q1 FY2026-27 fact sheet, with BFSI at 32.1% of revenue (Tata Consultancy Services, 2026). Wipro reported trailing-twelve-month voluntary attrition of 13.9% in the same quarter (Wipro, 2026). These are the best-run global delivery organizations in the world publishing their own numbers in investor filings. Roughly one engineer in seven leaves each year - and the buyer, not the vendor, absorbs the re-ramp.
The knowledge cost of departure is real and has been measured, if not in dollars. Robillard's interview study across three enterprise software companies identified four recurring mechanisms of post-departure cost - missing guidance and specifications, documentation that exists but cannot be used, dependence on informal networks, and outright reverse-engineering - and found that even internal transfers can constitute complete knowledge loss, because people forget systems they themselves built (Robillard, 2021). Earlier quantitative work found that more than a quarter of source files abandoned when a developer left remained abandoned for at least two years (Nassif and Robillard, 2017), and that when files were successfully taken over at one commercial organization, 81% went to developers with at least a year of tenure (Rigby et al., 2016). Continuity is not sentiment. It is the mechanism by which a codebase stays maintainable.
Ramp is measurable, but nobody has published the APAC number. Google's study of more than 3,000 new engineers validated two proxies for ramp-up and found remotely onboarded engineers took three to six weeks longer to reach comparable output (Green et al., 2023). That is a 2023 finding at a single global employer, and it measures a difference rather than an absolute. We looked hard for a credible, dated, methodology-disclosed ramp-time benchmark for financial services in Asia-Pacific and there is not one. Every widely quoted "three to six months to full productivity" figure we could trace ends at a vendor blog. The honest response is to measure your own, not to borrow someone's.
Strategic Analysis
The construct worth taking from this is narrow, and worth defining precisely so it can be argued with.
Retained capacity is the share of the engineer-months you pay for over a rolling twenty-four-month horizon that is delivered by people still working on your systems at the end of it. It is expressed as a percentage. Two things reduce it: attrition, when people leave the organization, and rotation, when contracted or vendor staff are reassigned off your account while remaining employed elsewhere.
The claim attached to it is this: the unit price of engineering is the cost divided by retained capacity, not the cost.
Work the arithmetic on published rates. A team sitting at the ASEAN average of 17.5% annual attrition retains about 68% of its people over twenty-four months. At the Philippines rate of 20.0%, about 64%. At Vietnam's or Indonesia's 15.0%, about 72% (Aon, 2025; compounding is ours). On the vendor side, TCS's disclosed 13.6% implies roughly 75% retention at firm level over the same horizon (Tata Consultancy Services, 2026) - but firm-level attrition is not account-level rotation, and no vendor publishes the latter. That gap matters, because rotation off an account is a commercial decision the vendor makes and the client discovers.
Now apply it. Two options quoted at the same US$10,000 per engineer-month, one retaining 72% and one retaining 55%, cost US$13,900 and US$18,200 per retained engineer-month respectively - a 31% difference that appears nowhere on either quotation. The board approved the cheaper of two identical numbers.
Three consequences follow, and the third is the one that changes decisions.
First, retained capacity is a design variable, not a market condition. Attrition rates differ by six percentage points across ASEAN markets on Aon's data alone. Location mix, contract structure, whether staff are badged to your product or to a resource pool, and whether the arrangement gives you named continuity or a headcount commitment all move the number. Most of them are negotiable at signature and almost none are negotiated.
Second, the two failure modes are asymmetric. Employee attrition is your number: you see it, you own it, you can act on it. Vendor rotation is invisible by construction - you see the invoice, not the roster - and it is not in your control. Equal percentages are not equal risks.
Third - and this is the honest counter-argument - retention is only valuable where the system outlives the engagement. For work that genuinely ends, retained capacity is the wrong metric entirely: a migration with a cutover date, a seasonal peak, a one-off certification against a scheme you will never touch again. There, renting is correct precisely because you do not want to keep the capability, and paying a retention premium is waste. The test is not whether the work is hard. It is whether anyone will need to change it in eighteen months. If yes, price retention. If no, buy the cheapest competent hours available and mean it.
Real-World Examples
Where the number moves the decision. A Series C payments business operating in three ASEAN markets modelled two options for a twelve-engineer platform group: a vendor arrangement at a blended rate roughly 18% below the cost of an insourced team in the same city. On rate alone the vendor won comfortably. On retained capacity it did not - the vendor's contract specified headcount and skill bands but named no individuals and permitted reassignment on thirty days' notice, while the insourced option carried a market attrition assumption drawn from the local published rate. Once both were expressed per retained engineer-month, the 18% advantage inverted. The decisive input was not cost. It was that one contract guaranteed people and the other guaranteed seats.
Where the number correctly says rent. The same company, in the same quarter, engaged an external specialist for a scheme certification with a fixed end date and no ongoing surface. Retained capacity was irrelevant: nobody would need that knowledge again. Insourcing it would have been an expensive way to hold a skill with no future demand. Both decisions came from the same model - which is the point. A framework that always produces "insource" is not a framework; it is a preference.
What it looks like when it is not measured. The common pattern is a platform whose original authors have all left, where every change is estimated with a multiplier "because nobody really knows that service", and where the multiplier is treated as a property of the system rather than as the accumulated cost of retaining nobody. Robillard's participants described exactly this: reverse-engineering as a routine cost of ordinary work (Robillard, 2021). It never appears as a line item. It appears as velocity that quietly halves.
Actionable Recommendations
Restate every sourcing option in cost per retained engineer-month. Take the fully-loaded monthly cost, divide by expected twenty-four-month retention, and compare only those numbers. Use the published attrition rate for the specific market rather than a group average - six points of spread across ASEAN is enough to change an answer.
Ask every vendor for account-level rotation, not firm-level attrition. Firm attrition is published and flattering. What you need is the percentage of named engineers on your account still on it twelve and twenty-four months later. A vendor that cannot produce it does not measure it, and one that will not is telling you something.
Contract for named continuity where the system persists. Continuity commitments, notice periods on reassignment, and a defined handover standard cost something at signature and are unbuyable afterwards. The moment to negotiate retention is before you need it.
Measure your own ramp, once, properly. No published APAC benchmark exists, so pick a definition - time from start date to first independent production change, say - fix it before you measure, and track it. Without it you cannot price retention because you cannot price its absence.
Separate work that ends from work that compounds, on paper, before you source either. One list gets rented on the best available rate. The other gets retention-weighted. Most organizations run a single sourcing policy across both and get both wrong in opposite directions.
Put the third-party governance cost in the model. If MAS issues its Third-Party Risk Management Guidelines broadly as consulted, reliance on third parties - not merely formal outsourcing - attracts registration, lifecycle and sub-contractor obligations after a six-month transition (Monetary Authority of Singapore, 2026). Whatever that costs your risk function belongs in the rented column.
The sourceCode Perspective
We build and run dedicated engineering teams for financial institutions across APAC, so our commercial interest in this argument is obvious and worth stating before the argument rather than after it.
What we would defend on the evidence is narrower than "insource". It is that retained capacity is the missing term in a calculation almost every board in the region is performing, and that its absence systematically favors whichever option has the lowest headline rate - which is not always, but is often, the one that retains least. We would rather a company ran that arithmetic and chose a vendor than skipped it and chose us.
We would also concede the limits. Retention is a cost input, not a virtue; a retained team working on the wrong thing is worse than a rented one working on the right thing. And there is no public benchmark for account-level rotation in APAC financial services, so the vendor side of any retained-capacity calculation currently rests on what a vendor will tell you. We think that is a reason to ask harder, not a reason to assume the worst.
Conclusion
The build-versus-buy debate has been conducted for two decades in a unit that does not survive contact with a labour market. Engineer-months are not fungible across time. The ones you keep are worth more than the ones you rent, and the ones you rent are worth exactly what they cost - sometimes the right answer, and sometimes an expensive one wearing a discount.
Aon's ASEAN attrition data, Nasscom's headcount-versus-revenue divergence, TCS's and Wipro's own filings and two decades of research on knowledge loss all point at the same omission. Nobody has to accept our conclusion to fix it. They only have to add one line to the model: of what we pay for, how much will still be ours in two years?
Boards that ask it tend to reach a more nuanced answer than either side of the outsourcing argument would like. That is usually the sign of a good question.
Run the numbers on your own team - it takes about four minutes.
The sourceCode Insourcing Cost Calculator takes your team size, your current mix of employed, contracted and vendor engineers, and your target markets, and returns a scored report: your estimated retained capacity over twenty-four months, your cost per retained engineer-month under each sourcing option, and a benchmark against sourceCode dedicated-team engagements in the same markets. The report is emailed; nothing is published, and nothing is shared.
If the report surfaces a gap worth talking through, it includes an option to book a 45-minute working session with a sourceCode delivery lead - an architecture and sourcing conversation, not a pitch.
→ Book a 45-minute sourcing review
Five APAC fintech stories worth your Weekends coffee
1. Visa to cut roughly 2,600 roles, weighted toward technology and product (28-29 July 2026, trade press) - about 7% of the workforce, framed as an AI-driven efficiency programme. Read it as the clearest available signal on where large-payments engineering cost curves are heading.
2. Maybank to acquire Ageas' stake in Etiqa for RM4.83 billion (3 August 2026) - Malaysia's largest bank pays roughly US$1.2 billion to take full control of its insurance arm. A control-over-partnership decision at balance-sheet scale, and a useful mirror of the sourcing argument above.
3. Bangko Sentral ng Pilipinas launches Direct Debit PH and raises the InstaPay business transfer limit to PHP 500,000 (29 July 2026) - genuine recurring-payment rails plus a materially higher business ceiling. Subscription and B2B use cases in the Philippines just became buildable.
4. Singapore FinTech Association publishes a voluntary Payments Industry Code of Conduct (3 August 2026) - bans drip pricing and requires FX mark-up disclosure before a transfer completes. Voluntary today; industry codes in Singapore have a habit of becoming the baseline.
5. HSBC reported to be selling its A$30 billion Australian home and personal loan book to Blackstone (30 July 2026, reported by Bloomberg and the AFR) - private credit steps into a major bank's Australian retail book. Reported rather than confirmed, and deal size varies across outlets; worth watching rather than citing.
Monday, 17 August: Week 3 opens on insurance - The AI Underwriting Renaissance Is Actually Happening in APAC, But Not Where the Reports Say, with the State of AI in APAC Insurance 2026 benchmark landing Wednesday.
FAQ
What is the difference between attrition and rotation in an engineering sourcing decision? Attrition is people leaving the organization; rotation is contracted or vendor staff being reassigned off your account while remaining employed by the vendor. Both reduce retained capacity identically, but they are asymmetric in one important way: attrition is a number you can see and manage, while rotation is a commercial decision made by someone else and usually discovered after the fact.
Is insourcing engineering always cheaper than outsourcing in APAC? No, and any framework that always produces the same answer is a preference rather than a framework. Where a system will outlive the engagement, retention weighting usually favours a dedicated or insourced team. Where the work genuinely ends - a migration with a cutover date, a seasonal peak, a one-off certification - retained capacity is irrelevant and renting the cheapest competent capacity is correct.
What attrition rate should I assume for an engineering team in Vietnam, Malaysia or the Philippines? Use the published market rate rather than a regional average. Aon's 2025 study puts Vietnam and Indonesia at 15.0%, Thailand at 17.2%, Malaysia at 18.2%, Singapore at 19.3% and the Philippines at 20.0%, against a Southeast Asian average of 17.5%. Six percentage points of spread across markets is enough to change a sourcing decision on its own.
How long does it take a new engineer to become productive? There is no credible, dated, methodology-disclosed benchmark for financial services in Asia-Pacific, and the widely quoted "three to six months" figure has no traceable research basis. The most rigorous published work - Google's study of more than 3,000 new engineers - reports a relative effect rather than an absolute: remotely onboarded engineers took three to six weeks longer to reach comparable output. Measure your own, against a definition fixed before you start measuring.
What does it actually cost when an engineer leaves? The published research quantifies exposure rather than dollars. More than a quarter of source files abandoned on a developer's departure remained abandoned for at least two years in one study of eight projects, and interview research across three enterprise software companies identified reverse-engineering, unusable documentation and dependence on informal networks as recurring costs of ordinary work afterwards. It rarely appears as a line item; it appears as velocity that quietly halves.
Does the MAS Third-Party Risk Management consultation change the outsourcing calculation? Potentially, yes. The proposed guidelines, consulted on between 6 March and 20 April 2026, would supersede the existing outsourcing guidelines and widen scope from formal outsourcing arrangements to all reliance on third-party services, with registration, a five-stage lifecycle and sub-contractor oversight, subject to a six-month transition on issuance. Whatever that costs a firm's risk function is a real cost of renting capability and belongs in the model.
Should I ask a vendor for their attrition rate? Ask for something more specific. Firm-level attrition is published, flattering and largely irrelevant to you - TCS disclosed 13.6% and Wipro 13.9% in their most recent quarters. What determines your retained capacity is the percentage of named engineers on your account still on it after twelve and twenty-four months. A vendor that cannot produce that figure does not measure it.
How do I calculate cost per retained engineer-month? Divide the fully-loaded monthly cost of the option by the fraction of its capacity you expect to retain over your planning horizon. At the same headline rate of US$10,000 per engineer-month, an option retaining 72% costs about US$13,900 per retained engineer-month and one retaining 55% costs about US$18,200 - a 31% difference that does not appear on either quotation.
References
Aon (2025) Salary Increase and Turnover Study 2025/26 - Southeast Asia. Singapore: Aon plc. Published 8 October 2025. Survey of more than 700 businesses across Indonesia, Malaysia, the Philippines, Singapore, Thailand and Vietnam, fielded July-September 2025. Available at: https://www.media-outreach.com/news/singapore/2025/10/08/416823/aon-survey-projects-moderate-salary-growth-of-5-3-percent-for-southeast-asia-in-2026/ (Accessed: 6 August 2026).
Australian Bureau of Statistics (2026) Employee Earnings and Hours, Australia, May 2025. Canberra: Australian Bureau of Statistics. Released 23 January 2026. Statutory employer survey. Available at: https://www.abs.gov.au/statistics/labour/earnings-and-working-conditions/employee-earnings-and-hours-australia/latest-release (Accessed: 6 August 2026).
Gartner (2026) Gartner Forecasts Worldwide IT Spending to Grow 14.2% in 2026, Totaling $6.37 Trillion. Stamford, CT: Gartner, Inc. Published 27 July 2026. Available at: https://www.gartner.com/en/newsroom/press-releases/2026-07-27-gartner-forecasts-worldwide-it-spending-to-grow-14-point-2-percent-in-2026-totaling-6-point-37-trillion (Accessed: 6 August 2026).
Green, C., Jaspan, C., Hodges, A., He, E. and Shen, S. (2023) 'Developer Productivity for Humans, Part 5: Onboarding and Ramp-Up', IEEE Software, 40, pp. 13-19. Study of more than 3,000 newly hired engineers at Google. Available at: https://research.google/pubs/developer-productivity-for-humans-part-5-onboarding-and-ramp-up/ (Accessed: 6 August 2026).
IDC (2026) Worldwide ICT Spending Guide, Enterprise and SMB by Industry - Asia/Pacific. Needham, MA: International Data Corporation. Data released April 2026. Available at: https://my.idc.com/getdoc.jsp?containerId=prAP53239525 (Accessed: 6 August 2026).
Jobs and Skills Australia (2025) Recruitment Experiences and Outlook Survey - November 2025. Canberra: Jobs and Skills Australia, Australian Government. Approximately 800 employers surveyed monthly; methodology published. Available at: https://www.jobsandskills.gov.au/data/recruitment-experiences-and-outlook-survey (Accessed: 6 August 2026).
Ministry of Manpower (2026a) Labor Market Report First Quarter 2026. Singapore: Ministry of Manpower. Published 15 June 2026. Available at: https://www.mom.gov.sg/newsroom/press-releases/2026/0615-lmr-1q-2026 (Accessed: 6 August 2026).
Ministry of Manpower (2026b) Job Vacancies 2025. Singapore: Ministry of Manpower, Manpower Research and Statistics Department. Published 20 March 2026. Available at: https://stats.mom.gov.sg/ (Accessed: 6 August 2026).
Monetary Authority of Singapore (2026) Consultation Paper on Proposed Guidelines on Third-Party Risk Management. Singapore: Monetary Authority of Singapore. Consultation open 6 March - 20 April 2026. Available at: https://www.mas.gov.sg/regulation/third-party-risk-management (Accessed: 6 August 2026).
Nasscom (2026) Strategic Review 2026. Noida: National Association of Software and Service Companies. Published 22 May 2026. Available at: https://nasscom.in/ (Accessed: 6 August 2026).
Nassif, M. and Robillard, M.P. (2017) 'Revisiting Turnover-Induced Knowledge Loss in Software Projects', Proceedings of the 33rd IEEE International Conference on Software Maintenance and Evolution (ICSME). Analysis of eight open-source projects. Available at: https://www.cs.mcgill.ca/~martin/papers/icsme2017.pdf (Accessed: 6 August 2026).
Rigby, P.C., Zhu, Y.C., Donadelli, S.M. and Mockus, A. (2016) 'Quantifying and Mitigating Turnover-Induced Knowledge Loss: Case Studies of Chrome and a Project at Avaya', Proceedings of the 38th International Conference on Software Engineering (ICSE), pp. 1006-1016. Available at: https://dl.acm.org/doi/10.1145/2884781.2884851 (Accessed: 6 August 2026).
Robillard, M.P. (2021) 'Turnover-Induced Knowledge Loss in Practice', Proceedings of the 29th ACM Joint European Software Engineering Conference and Symposium on the Foundations of Software Engineering (ESEC/FSE). Twenty-seven interviews across three enterprise software companies; validation survey with nine participants. Available at: https://www.cs.mcgill.ca/~martin/papers/esecfse2021.pdf (Accessed: 6 August 2026).
Tata Consultancy Services (2026) Q1 FY 2026-27 Fact Sheet. Mumbai: Tata Consultancy Services Ltd. Published 9 July 2026. Available at: https://www.tcs.com/content/dam/tcs/investor-relations/financial-statements/2026-27/q1/Presentations/Q1%202026-27%20Fact%20Sheet.pdf (Accessed: 6 August 2026).
Wipro (2026) Wipro Announces Results for the Quarter Ended June 30, 2026. Bengaluru: Wipro Limited. Published 16 July 2026. Available at: https://www.wipro.com/newsroom/press-releases/2026/wipro-announces-results-for-the-quarter-ended-june-30-2026/ (Accessed: 6 August 2026).