APAC Core Banking Modernization by the Numbers 2026: The Four Ratios That Decide Who Wins the Next Three Years
Executive Summary
Asia/Pacific excluding Japan and China will spend approximately US$647 billion on ICT in 2026, up 5.4 per cent year on year and on track to exceed US$758 billion by 2029, with banking among the largest contributing industries (IDC, 2026). More money is available for core banking modernization in this region than at any point in its history. The uncomfortable finding is that the size of the budget has almost no predictive power over the outcome. Four ratios do. First, the run-the-bank ratio: roughly 65 per cent of APAC retail banking IT expenditure defends the existing estate rather than changing it (Celent, 2024 survey wave, cited in Finastra, 2025). Second, the regulatory density ratio: APAC jurisdictions account for approximately 57 per cent of all jurisdictions worldwide that have issued open finance regulations (Cambridge Centre for Alternative Finance and Asian Development Bank, 2025), and financial crime compliance alone cost APAC financial institutions an estimated US$45 billion in 2023 (LexisNexis Risk Solutions, 2024) - more regulatory surface area per dollar of technology budget than institutions in most other markets carry. Third, the delivery reliability ratio: 94 per cent of core modernization projects exceed their planned timelines (IBM Institute for Business Value, 2025). Fourth, the throughput ratio: Asia-Pacific is forecast to exceed 351.5 billion real-time transactions annually by 2028, a 13.6 per cent compound annual growth rate from 2023 (ACI Worldwide and GlobalData, 2024) - a volume curve batch-era cores cannot absorb by adding hardware. A fifth number is not published anywhere, because no analyst collects it: the proportion of the platform fabric a bank actually owns. In our experience it is the one that predicts outcomes best. This analysis quantifies each ratio, sets out what "good" looks like, and closes with a direct read on APRA's newly finalized exemptions for non-traditional service providers: they are not a loophole, they are a stress test of whether your risk register maps to reality.
Introduction: The Budget Was Never the Constraint
Every APAC banking executive has now sat through the version of this conversation where the answer is a bigger number. More budget, more vendors, more programme managers, a bigger systems integrator. The regional spend data says that answer has been comprehensively tried. IDC's April 2026 forecast puts ICT spending across Asia/Pacific excluding Japan and China at US$647 billion this year, up 5.4 per cent year on year, on the way to more than US$758 billion by 2029 (IDC, 2026). Banking sits among the top contributing industry blocks. Capital is not the binding constraint in APAC banking technology, and it has not been for several years.
What the data does say is that the composition of the spend - not its size - determines whether it compounds. A dollar that lands on a fabric a bank owns reduces the price of the next dollar. A dollar that lands on a vendor release cycle raises it. This piece isolates the four published ratios that measure that difference, and the one unpublished ratio that explains most of the variance we see in the field.
Industry Context: Three Cost Curves Moving at Different Speeds
The strategic context for 2026 is a scissors problem. Regional technology budgets are growing at roughly 5 per cent a year. Regulatory obligation is growing considerably faster - CPS 230 took full effect in Australia on 1 July 2026, the Monetary Authority of Singapore is moving its AI risk management guidance from consultation into supervisory expectation, and open finance rules continue to proliferate across the region. Transaction volume is growing fastest of all: real-time payments in Asia-Pacific are compounding at 13.6 per cent a year toward the 351.5 billion annual transactions forecast for 2028 (ACI Worldwide and GlobalData, 2024).
Three curves, three different gradients, one technology fabric underneath all of them. When budget grows at 5 per cent and obligation plus volume grow at multiples of that, the only reconciling variable is the unit cost of change. That is the number APAC banking boards should be tracking quarterly, and almost none currently do.
Current Challenges: The Four Ratios, Quantified
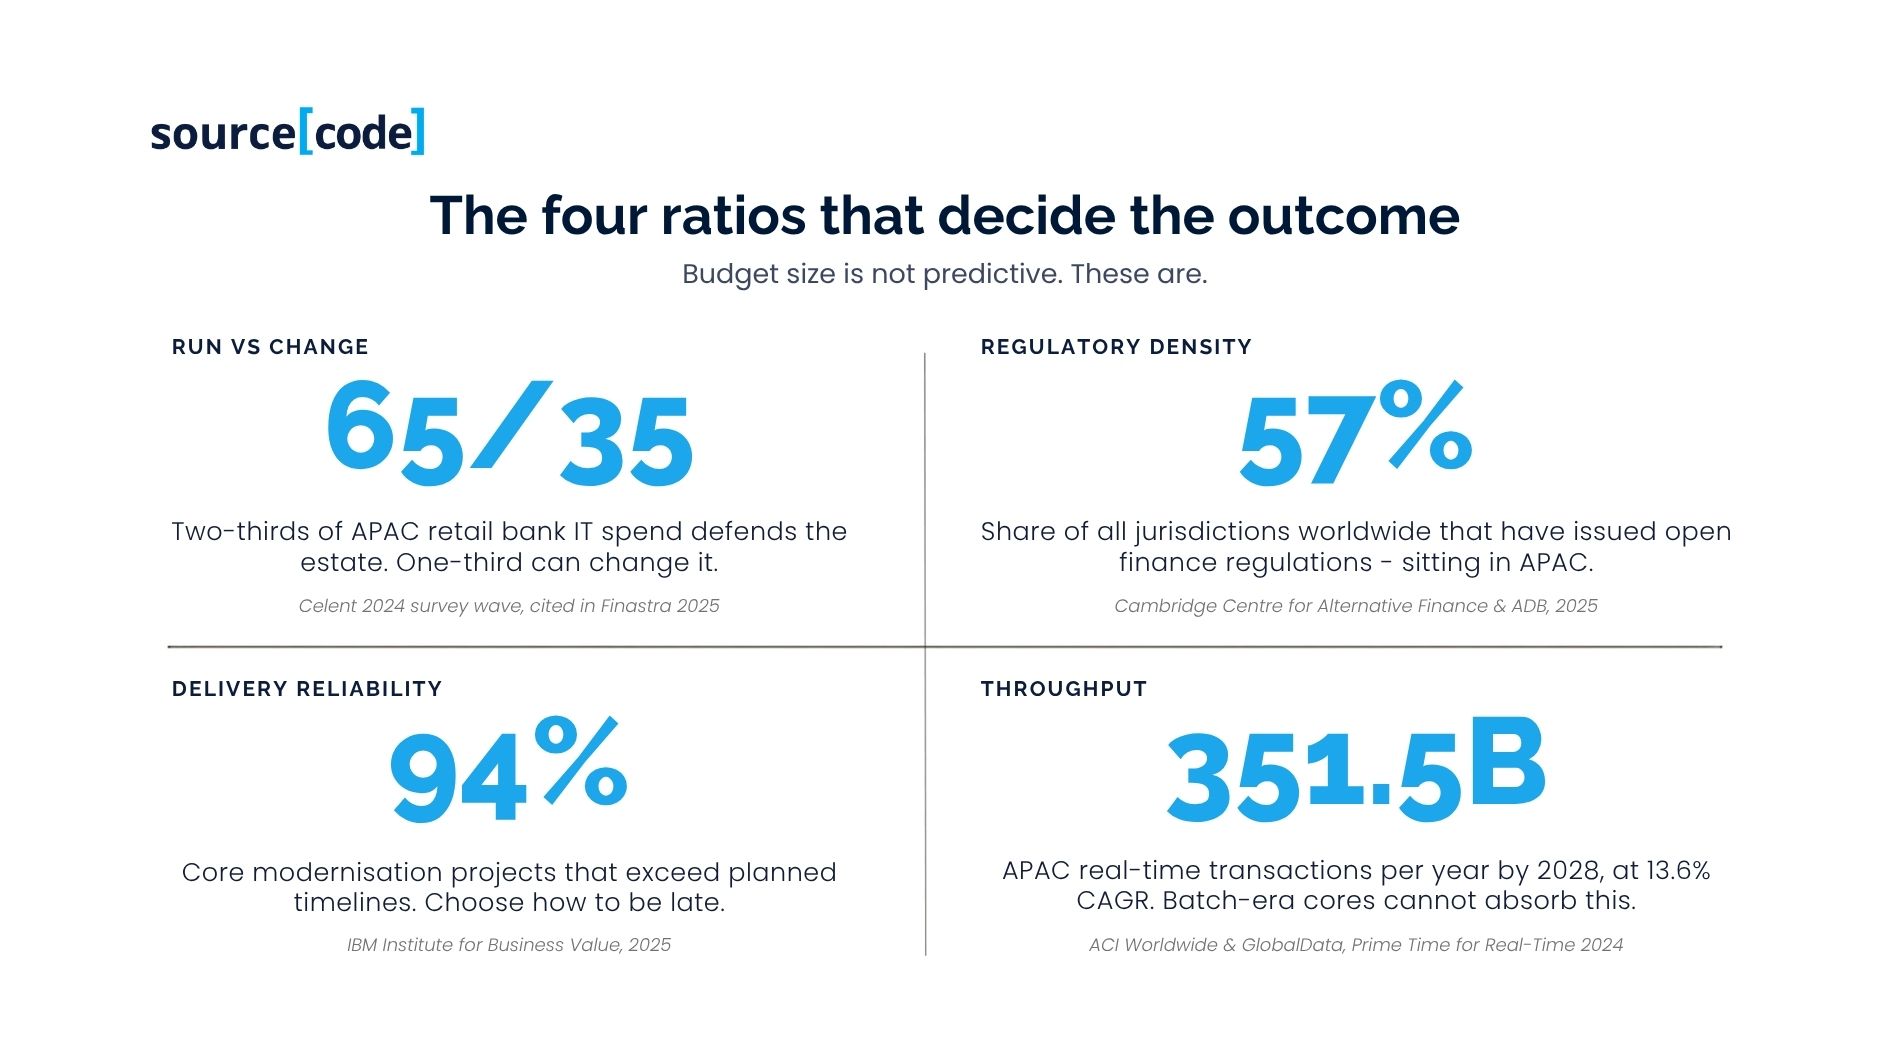
Ratio 1 - Run-the-bank vs change-the-bank: 65/35
Approximately 65 per cent of total IT expenditure across Asia-Pacific retail banking is allocated to "run the bank" activity - keeping the existing estate available, patched, compliant and integrated (Celent, Dimensions: Asia Pacific Retail Banking IT Pressures & Priorities, 2024 survey wave, cited in Finastra, 2025). Only the remaining third is genuinely available to change anything.
The strategic implication is arithmetical rather than philosophical. A bank running at 65/35 with a US$200 million technology budget has US$70 million of change capacity. A bank that gets to 50/50 has US$100 million - a 43 per cent increase in change capacity with no increase in budget, and no board approval required beyond the architectural decision itself. This is the largest untapped funding source in APAC banking, and it is available without asking the CFO for anything.
Benchmark to hold: leading composable-core institutions we work with operate between 45/55 and 55/45. If your ratio is worse than 65/35, you are behind the regional average and the modernization business case is already written - it is a cost-release case, not a growth case, and cost-release cases survive budget committees that growth cases do not.
Ratio 2 - Regulatory density: APAC carries a disproportionate share
Asia-Pacific jurisdictions account for approximately 57 per cent of all jurisdictions globally that have issued open finance regulations (Cambridge Centre for Alternative Finance and Asian Development Bank, 2025). Separately, financial crime compliance alone cost APAC financial institutions an estimated US$45 billion in 2023 (LexisNexis Risk Solutions, 2024) - and financial crime is one obligation among many. Set that against a region whose technology budgets are, per institution, materially smaller than their North American and Western European peers, and the picture is clear: APAC banks absorb more regulatory change per dollar of technology spend than banks in most other markets.
That is the actual competitive disadvantage of operating in this region - and it is also the largest available source of advantage, because regulatory density rewards architectural optionality more than any other market condition. In a low-density market, absorbing obligations as one-off programmes is survivable. At APAC density, it is not: the programmes overlap, and each one lands on a fabric already deformed by the last.
Ratio 3 - Delivery reliability: 94 per cent overrun
IBM's Institute for Business Value finds that 94 per cent of core banking modernization projects exceed their planned timelines, with consequent damage to return on investment (IBM IBV, 2025). This is a global figure, and it is the most important number in this analysis, because it reframes what a modernization decision actually is.
If 94 per cent of programmes overrun, then a board approving a core modernization programme is not choosing between "on time" and "late". It is choosing how it wants to be late. A big-bang programme that is late is late all at once, with no delivered value and a concentrated cutover risk still ahead of it. An incremental programme that is late has already delivered a proportion of its value, and its remaining risk is distributed across many small cutovers. The overrun rate is roughly constant; the cost of overrun is an architectural choice.
Ambition compounds this. In Celent's 2024 survey wave, around 70 per cent of APAC retail banks planned to launch customer-facing generative AI services within that year, and more than half planned to move additional workloads to public cloud (cited in Finastra, 2025). Ambition at 70 per cent, delivery reliability at 6 per cent. The gap between those two numbers is where credibility is lost - with boards, with regulators, and with customers. Two years on, the honest executive question is how much of that 2024 ambition actually reached production.
Ratio 4 - Throughput: 351.5 billion transactions by 2028
Asia-Pacific is forecast to exceed 351.5 billion real-time transactions annually by 2028, growing at a 13.6 per cent compound annual rate from 2023 (ACI Worldwide and GlobalData, Prime Time for Real-Time, 2024). Real-time payment rails do not merely add volume; they change the shape of the load. They replace predictable nightly batch windows with continuous, spiky, always-on demand - precisely the profile a batch-era core was never designed to serve.
This matters directly to the operational resilience conversation. A tolerance level of minutes for a real-time payment rail is not a documentation exercise; it is a statement about architecture that a regulator can now test. Volume growth and tolerance compression are arriving together, and they are the same problem.
The fifth ratio nobody publishes: ownership
No analyst house measures the proportion of the platform fabric a bank actually owns and operates - the share of core platform capability where the bank's own permanent engineers hold the design authority, the deployment pipeline and the observability. In our engagements across APAC banking, it correlates with delivery outcomes more strongly than vendor choice, budget size or programme methodology.
The mechanism is straightforward. Where the bank owns the fabric, a regulatory change is a pull request. Where a vendor owns it, the same change is a roadmap negotiation, a release window and a professional-services statement of work. Two institutions with identical budgets and identical vendors can differ by a factor of three in unit cost of change purely on this variable.
Key Trends: What the 2026 Numbers Are Actually Signaling
Trend 1 - Cost-release is displacing growth as the modernization business case. With returns compressed across the region and budgets growing at single digits, the run-the-bank ratio is a more persuasive board argument than any revenue projection. The banks winning approval in 2026 are leading with change-capacity release, not with new product revenue.
Trend 2 - Regulatory obligation is being treated as a design input, not a compliance output. The institutions moving fastest are architecting for the obligations they can see coming in the next twenty-four months, not the one that arrived last quarter.
Trend 3 - Programme methodology is converging on incremental delivery, driven by the 94 per cent figure rather than by ideology. Nobody in APAC banking is arguing for big-bang on merit any more; where it persists, it persists as sunk-cost commitment.
Trend 4 - Sovereign and regional cloud requirements are reshaping concentration risk. Data sovereignty and residency requirements across ASEAN are pushing banks toward multi-region and, in some cases, multi-provider designs - which cuts against the cost logic of single-hyperscaler consolidation. This tension is unresolved and will define 2027 architecture decisions.
Trend 5 - The measurement layer itself is becoming a differentiator. Banks that can produce their run/change ratio, unit cost of change, and tolerance-versus-capability position on demand are running a different quality of board conversation than banks that produce them annually for the budget cycle.
Strategic Analysis: Why APRA's NTSP Exemption Is a Stress Test, Not a Loophole
On 30 April 2026, APRA finalized targeted amendments to CPS 230, CPG 230 and the Material Service Provider Register template, effective 1 July 2026. The amendments create limited exemptions from specified contractual requirements for material arrangements with non-traditional service providers - government agencies, regulators, central banks, financial market exchanges, clearing and settlement facility operators, payment systems operators, and financial messaging infrastructures - where the arrangement is on standardized terms or is not formally documented, and imposing CPS 230's contractual requirements is therefore not practicable (APRA, 2026; Norton Rose Fulbright, 2026).
The market reaction has been to file this as relief. That reading misses what the amendment actually does.
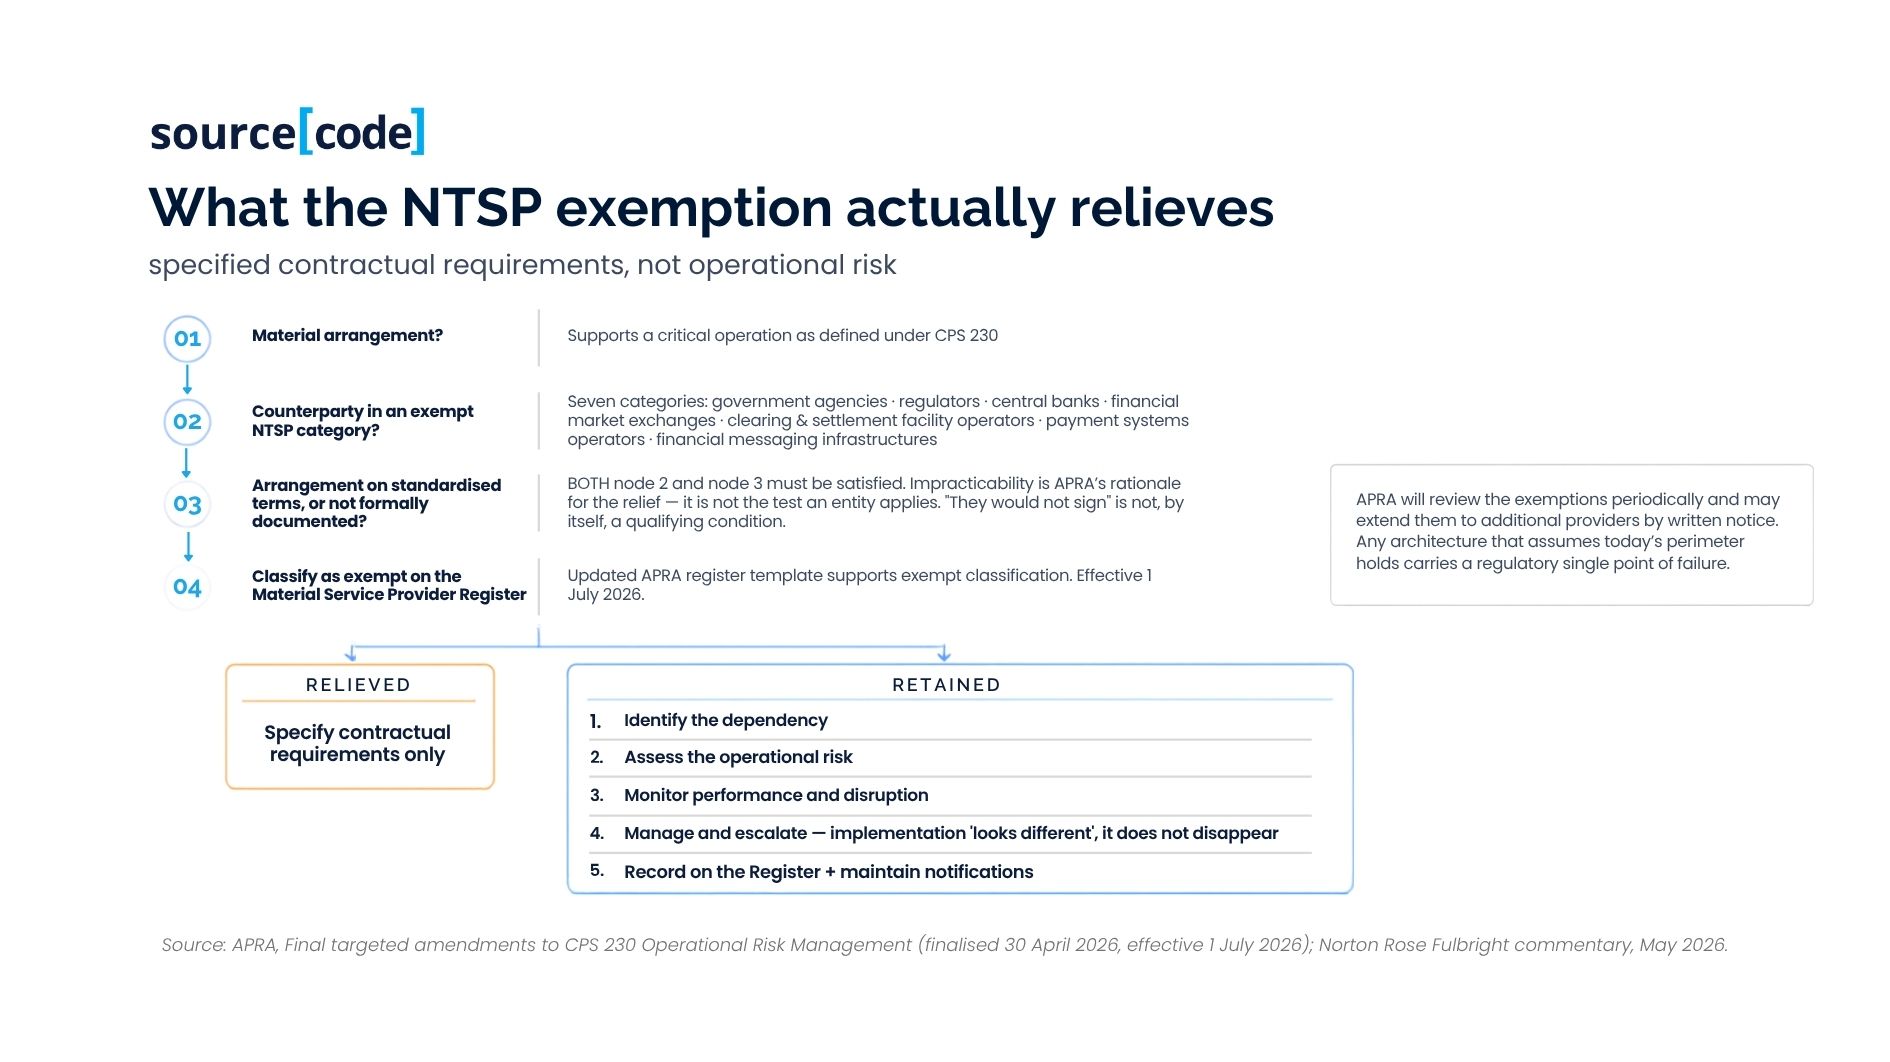
Three points deserve executive attention.
First, the exemption is contractual, not operational. What is relieved is the obligation to impose specified contractual terms on a counterparty that will never accept them - you are not going to negotiate an audit-rights clause with a central bank or a financial messaging infrastructure. What is emphatically not relieved is the obligation to identify, assess, monitor and manage the operational risk of that dependency. APRA's guidance is explicit that implementation for an exempt provider will simply look different, acknowledging information asymmetry, not that it disappears.
Second, the register template now forces a declaration. The updated Material Service Provider Register allows entities to classify an arrangement as exempt. That is a declaration to a supervisor: we have assessed this dependency, we have concluded it meets the exempt criteria, and here is how we manage the risk instead. Every exempt classification is an invitation to be asked the follow-up question. Banks that classify liberally without an operational answer behind each entry have created supervisory exposure, not removed it.
Third, APRA retained the dial. The regulator will review the exemptions periodically and can grant exemptions for additional providers by written notice. The perimeter is deliberately movable. Any architecture that depends on the current perimeter holding is an architecture with a regulatory single point of failure in it.
Note also the precision of the operative test. Relief is not available simply because a counterparty is powerful or the negotiation is difficult. It requires both an exempt category and an arrangement on standardised or undocumented terms. Impracticability is APRA's rationale for the relief; it is not the test an entity applies. Institutions that have read the amendment as "we could not get them to sign, therefore we are exempt" have misread it, and that misreading will surface in supervision rather than in the register.
The executive read: the exemption is a diagnostic instrument. It asks whether an institution can distinguish between dependencies it cannot contract with and dependencies it has simply failed to contract with properly. Institutions with a live, architecture-linked register answer that in an afternoon. Institutions with a spreadsheet answer it in a fortnight, and answer it worse.
Real-World Examples: What the Ratios Look Like in Practice
Example 1 - The 65/35 trap, quantified. A Southeast Asian commercial bank we assessed in the first half of 2026 was running close to the regional 65/35 benchmark. Nearly two-thirds of its run spend traced to integration middleware and reconciliation processes that existed solely because four systems held overlapping copies of the same customer and account data. No new capability was being funded by that money; it was the carrying cost of a data model decision made more than a decade earlier. The modernization business case was not a growth story. It was the release of a recurring cost the bank had stopped noticing.
Example 2 - The overrun that delivered anyway. An APAC digital bank's migration off a legacy general-ledger core ran past its internal milestone dates - placing it squarely inside the 94 per cent - yet completed materially ahead of its original vendor-estimated schedule and delivered cost reduction in core operations within the first year post-migration. The distinguishing feature was sequencing: capability-by-capability cutover behind a stable façade, with observability instrumented before the first component moved. Late, and successful, are not mutually exclusive. (Full detail in Thursday's case study.)
Example 3 - The exempt-classification test. A mid-tier Australian institution preparing for the 1 July effective date rebuilt its Material Service Provider Register as an object graph rather than a spreadsheet - each provider linked to the critical operations it supports, the tolerance defended, and the observability signal that proves it. When the NTSP amendments landed, applying the new exempt classification across the register was a data exercise completed in days rather than a re-papering programme. The architecture decision made the regulatory change cheap.
Actionable Recommendations: Five Numbers to Put in the Next Board Pack
1. Publish your run-the-bank ratio, quarterly. If it is worse than 65/35 you are below the regional benchmark and the modernization case is a cost-release case. Track the trend line, not the absolute value - direction of travel is what a board can act on.
2. Calculate your unit cost of change. Total technology spend divided by delivered change units (releases, features, regulatory obligations absorbed - pick a definition and hold it). This is the single number that tells a board whether last year's architecture spend worked. Almost no APAC bank currently reports it.
3. Assume the 94 per cent applies to you, and re-sequence accordingly. Do not budget for being the exception. Structure the programme so that overrun costs you a delayed increment rather than a delayed programme. Ask of every plan: if this is nine months late, what have we delivered by then? If the answer is "nothing", the plan is wrong regardless of its timeline.
4. Audit every exempt classification on your Material Service Provider Register before your next supervisory engagement. For each one, be able to state in a sentence which exempt category applies, why the arrangement is on standardised or undocumented terms, and what compensating operational controls are in place. If you cannot answer all three, remove the classification.
5. Measure your ownership ratio and set a target. What proportion of your critical platform capability is designed, deployed and observed by your own permanent engineers? Set a three-year target and fund the path to it. This is the ratio that determines whether the other four improve.
The sourceCode Perspective: Composition Beats Quantum
Across our APAC banking engagements, the variable that best predicts whether a modernization dollar compounds is not the size of the programme, the caliber of the vendor or the maturity of the methodology. It is whether the bank ends the programme owning more of its own fabric than it did at the start.
That is why we structure engagements around insourced platform teams with variable delivery capacity around them, observability instrumented before migration rather than after, and policy-as-code enforcement from day one. Not as a delivery preference, but because those three choices are what move the run-the-bank ratio, and the run-the-bank ratio is what funds everything else.
We would offer one caution against reading these ratios too mechanically. A bank at 70/30 with a stable, well-understood estate and no near-term regulatory exposure is in a defensible position. A bank at 55/45 that achieved the improvement by deferring maintenance is in a considerably worse one that the ratio flatters. The numbers are a diagnostic, not a scoreboard - and the diagnosis still requires judgement about the specific estate.
Conclusion: The Ratios Are Already Decided for 2026
Regional technology budgets will grow at roughly 5 per cent through 2029. Regulatory obligation and transaction volume will grow faster. No APAC bank will close that gap by spending more, because spending more is what the last five years already tested.
The gap closes on composition. A bank that moves from 65/35 to 55/45 releases more change capacity than most modernization programmes deliver in their first two years - and it does so from the existing budget, without a new business case. The institutions that understand this are not running bigger programmes in 2026. They are running programmes designed to change the ratio, and reporting the ratio to their boards quarterly so that everyone can see whether it is working.
The four published ratios are available to any executive who wants to benchmark against them. The fifth - ownership - is the one your competitors are not measuring either. That is precisely why it is worth measuring first.
See where your bank sits against all five ratios. The full APAC Core Banking Modernization Playbook 2026 - including the run/change benchmark table, the unit-cost-of-change calculation method, the ownership-ratio scoring rubric and the CPS 230 addendum covering the NTSP amendments - is available via the link in the first comment of today's carousel.
For a second read on your own numbers, sourceCode's are running complimentary 30-minute Architecture Reviews through August. We will walk your current-state architecture and identify your top three CPS 230 exposure points, in writing, with no obligation.
Frequently Asked Questions
What is the run-the-bank ratio? The run-the-bank ratio is the share of a bank's total technology expenditure spent maintaining, patching, integrating and supporting the existing estate rather than building new capability; across Asia-Pacific retail banking it was measured at approximately 65 per cent in Celent's 2024 survey wave.
How much will Asia-Pacific spend on technology in 2026? IDC forecasts ICT spending of approximately US$647 billion in 2026 across Asia/Pacific excluding Japan and China, growing 5.4 per cent year on year and exceeding US$758 billion by 2029, with banking among the largest contributing industry blocks.
What proportion of core banking modernization projects run late? IBM's Institute for Business Value finds that 94 per cent of core banking modernization projects exceed their planned timelines, which makes the cost of overrun - determined by delivery sequencing - more strategically important than the probability of overrun.
What is a non-traditional service provider under CPS 230? Under APRA's amendments effective 1 July 2026, a non-traditional service provider is a counterparty in one of seven categories - government agencies, regulators, central banks, financial market exchanges, clearing and settlement facility operators, payment systems operators, and financial messaging infrastructures - with which an APRA-regulated entity holds a material arrangement on standardised or undocumented terms; limited exemptions apply to specified contractual requirements only.
Does the NTSP exemption remove the obligation to manage the risk? No. The exemption is limited to specified contractual requirements. The obligation to identify, assess, monitor and manage the operational risk of the arrangement remains in full, and the arrangement must still be recorded - now with an exempt classification - on the Material Service Provider Register.
What is regulatory density and why does it matter in APAC? Regulatory density is the volume of regulatory change an institution must absorb per unit of technology budget; Asia-Pacific jurisdictions account for roughly 57 per cent of all jurisdictions worldwide that have issued open finance regulations, against per-institution technology budgets typically smaller than North American or European peers, which makes architectural optionality worth more in this region than in most others.
How large is the real-time payments volume APAC banks must architect for? Asia-Pacific is forecast to exceed 351.5 billion real-time transactions annually by 2028, growing at 13.6 per cent a year from 2023 - a load profile that replaces predictable batch windows with continuous demand and cannot be absorbed by scaling batch-era core infrastructure.
References
ACI Worldwide and GlobalData, 2024. Prime Time for Real-Time 2024. Available at: https://www.businesswire.com/news/home/20240429624485/en/ [Accessed 29 July 2026].
Australian Prudential Regulation Authority (APRA), 2026. APRA finalises targeted amendments to CPS 230 Operational Risk Management, 30 April. Available at: https://www.apra.gov.au/news-and-publications/apra-finalises-targeted-amendments-cps-230-operational-risk-management [Accessed 29 July 2026].
Australian Prudential Regulation Authority (APRA), 2026. Final targeted amendments to CPS 230 Operational Risk Management. Available at: https://www.apra.gov.au/final-targeted-amendments-to-cps-230-operational-risk-management [Accessed 29 July 2026].
Backbase, 2026. Asia Banking Predictions Report 2026. Available at: https://www.backbase.com/focus/asia-banking-predictions-report-2026 [Accessed 29 July 2026]. (Secondary citation for the real-time payments and open finance figures; primary sources cited directly above and below.)
Cambridge Centre for Alternative Finance (Cambridge Judge Business School) and Asian Development Bank, 2025. The APAC State of Open Banking and Open Finance Report. Available at: https://www.jbs.cam.ac.uk/2025/open-banking-and-finance-accelerate-across-apac-region/ [Accessed 29 July 2026].
Celent, 2024. Dimensions: Asia Pacific Retail Banking IT Pressures & Priorities in 2024. Cited in Finastra, 2025 (below).
Finastra, 2025. Future-proofing Asia Pacific Banks' IT Infrastructure to Power Agility and Sustainable Growth, 6 May. Available at: https://www.finastra.com/viewpoints/articles/future-proofing-asia-pacific-banks-it-infrastructure-power-agility-and [Accessed 29 July 2026].
IBM Institute for Business Value, 2025. The 94% Core Banking Problem, 22 September. Available at: https://www.ibm.com/thought-leadership/institute-business-value/en-us/report/core-banking-modernization [Accessed 29 July 2026].
International Data Corporation (IDC), 2026. Asia/Pacific (excluding Japan and China) ICT Spending to Reach US$647 Billion in 2026, 10 April. Available at: https://www.telecompaper.com/news/asia-pacific-ict-spending-set-to-reach-usd-647-bln-in-2026-idc--1566809 [Accessed 29 July 2026].
LexisNexis Risk Solutions, 2024. True Cost of Financial Crime Compliance - Asia Pacific, 6 March. Available at: https://risk.lexisnexis.com/global/en/about-us/press-room/press-release/20240306-true-cost-of-compliance [Accessed 29 July 2026].
Norton Rose Fulbright (Global Regulation Tomorrow), 2026. APRA finalises targeted amendments to CPS 230 Operational Risk Management, May. Available at: https://www.regulationtomorrow.com/2026/05/apra-finalises-targeted-amendments-to-cps-230-operational-risk-management/ [Accessed 29 July 2026].
The Asian Banker, 2026. Asia Pacific Banks Must Modernise Infrastructure Without Surrendering Their Trust Advantage. Available at: https://www.theasianbanker.com/updates-and-articles/asia-pacific-banks-must-modernise-infrastructure-without-surrendering-their-trust-advantage [Accessed 29 July 2026].